Power Automate has an action “Export to File for Power BI Reports” which enables you to export a Power BI Visual or Page as a PDF, Power Point (PPTX) or Image (PNG) file. Below you will learn about the Workspace requirements, how to identify the report page and visual names and how to implement a report level filter. We will explore common errors, how to setup your Power Automate Cloud flow, some of the limitations, the Power BI Playground and finally saving the exported file to SharePoint and sending via Teams or Email.
1. Common Problems / Errors
Some common errors that you might experience when trying to use this action include:
1.1. FeatureNotAvailable
{"error":{"code":"FeatureNotAvailableError","pbi.error":{"code":"FeatureNotAvailableError","parameters":{},"details":[]}}}
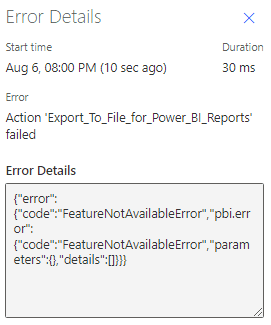
This refers to the licensing requirements, specifically that you must have an embedded capacity on your tenant for BI. Exporting a Power BI report to file using the exportToFile API, is not supported for Premium Per User (PPU). You can follow this Microsoft guide to setup an embedded capacity.
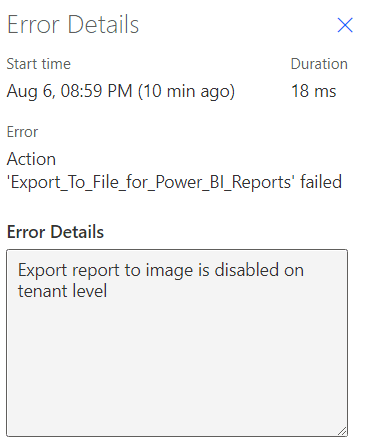
1.2. Export report to image is disabled on tenant level
This error refers to a tenant wide setting that specifically prohibits the use of the Power BI API to export reports as images.
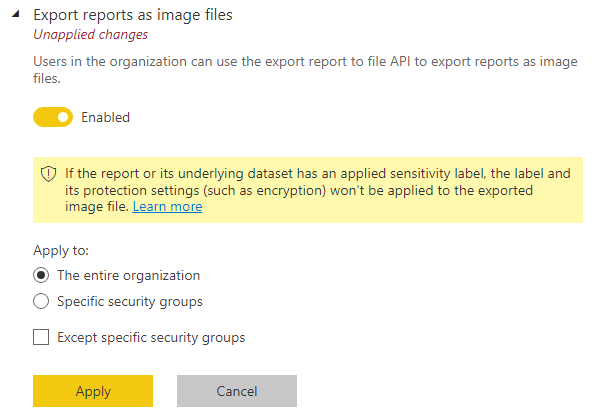
A setting “Export reports as image files” is available via the Power BI Admin Portal, Tenant Settings. You can enable this feature either for the whole organization or maybe a specific security group. You have to be a global admin or Power BI service admin to access the Power BI admin portal.
2. The Power Automate Action
Let’s now explore the action in order to export a report or visual, with a filter.
2.1. Action configuration
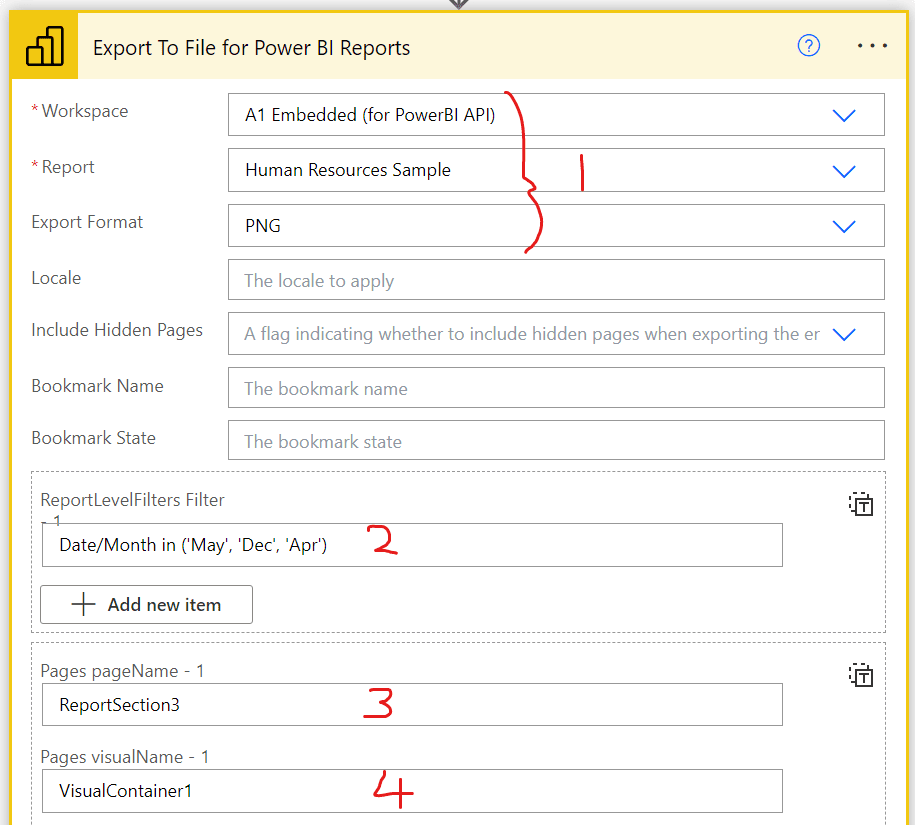
Based on the screenshot below, 1. the initial settings are straight forward, specify the Embedded Capacity Workspace, the Report and the Export format (in my case an image as png).
2.2. Report Level Filters
We can implement a filter based on a single table/field, some sample filters are available to view here. The filter is not based on the physical slicer in a report itself. Therefore, if you plan to run a report / visual extract, your drilling does not appear to affect the output of the visual. I overcame this by embedding a Power App, linking the single data table to the App and sending the selected data to Power Automate to implement as a dynamic filter. I will write this up if there is interest, albeit I plan to do a video demo on my YouTube.
2.3. Page Name
Page and Visual name go together, albeit Visual is optional. You must specify a Page in order to export and you can in fact export multiple pages / visuals in one action by creating an array. Note that if you specify multiple pages/visuals, the output of the action will be a zip file of specific files (e.g. png), rather than an array of png’s. You would therefore need to save and extract the images from the zip file output.
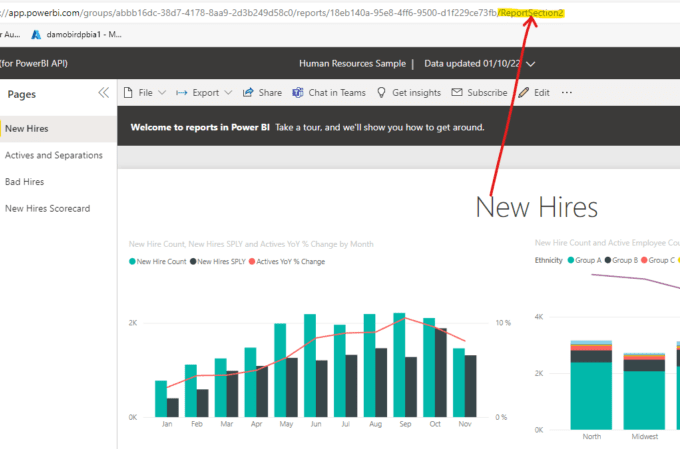
Retrieving the page name, in this case “ReportSection2” is rather straightforward. Open up your report and navigate to the page in question. The page name is in the URL and appears as the last value after the reports guid (as highlighted below). If you are unable to retrieve it this way, don’t worry, there is an alternative method that I will explain for your visuals.
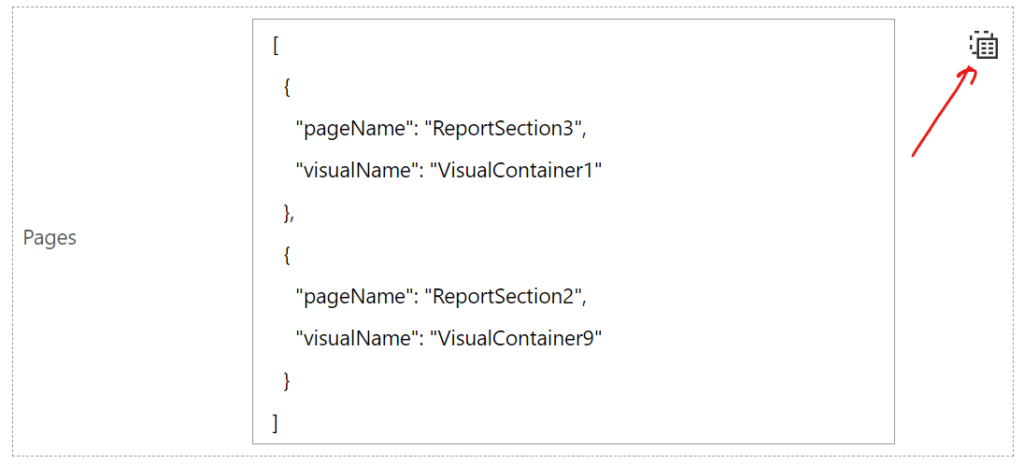
If you are looking to retrieve multiple pages / visuals, turn on text mode for the Pages parameter, you can supply an array of objects for pageName and visualName. Remember that a Select Action is very handy here and the output of a select could be supplied directly to the Pages parameter.
2.4. Visual Name
The visual is that specific pie chart or bar chart etc. Its appearance is not based on any filters you apply to the report in real time, remember that you can specify a single filter using the parameter described above.
Retrieving the visual name is a bit more complicated as you will need to use the Power BI Playground to retrieve these.
3. Power BI Playground
We will now explore how to use the Playgroud to retrieve both the page and visual names. Open the playground and choose try the developer sandbox.

You will then be asked how you would like to start and of course we want to “Use My Own Report” and click on “Select Report”. Connect to your report and hopefully you will see something like follows:
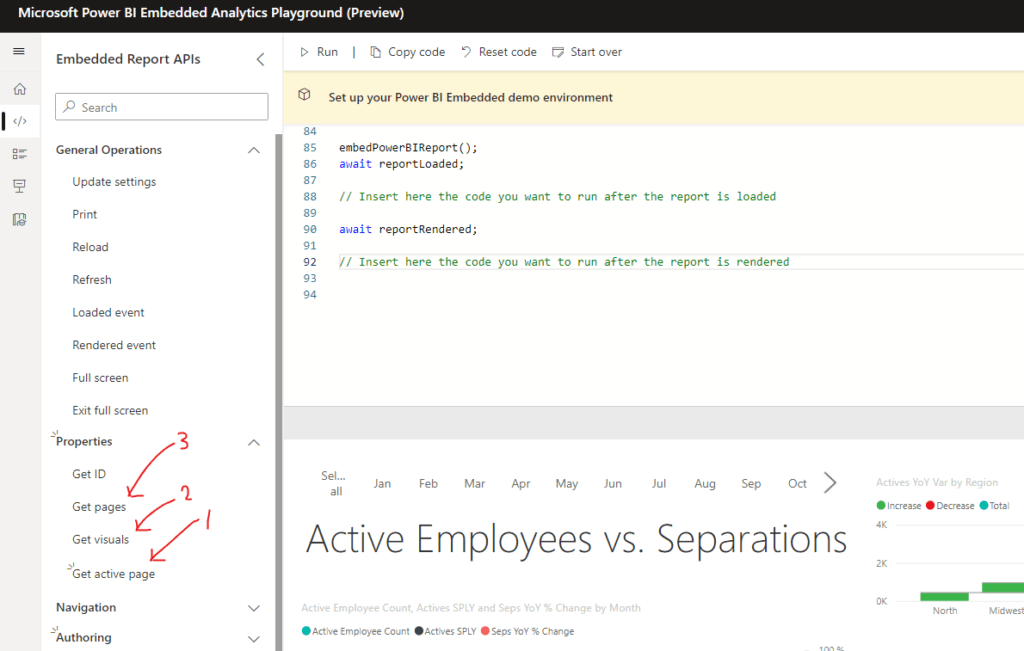
Note that I have expanded the properties tab to highlight 3 code samples that you will require. You can run these by clearing out any existing code on the screen and dragging the code block across. You can then run the code and view the output using the browser developer tools. Access to the “console window” in developer tools is achieved quickly, by pressing ctrl + shift + j. Alternatively, you can access via the browser settings, more tools, developer tools and make sure you are on the console tab. Here is a guide for edge if you are unsure.
3.1. Get active page
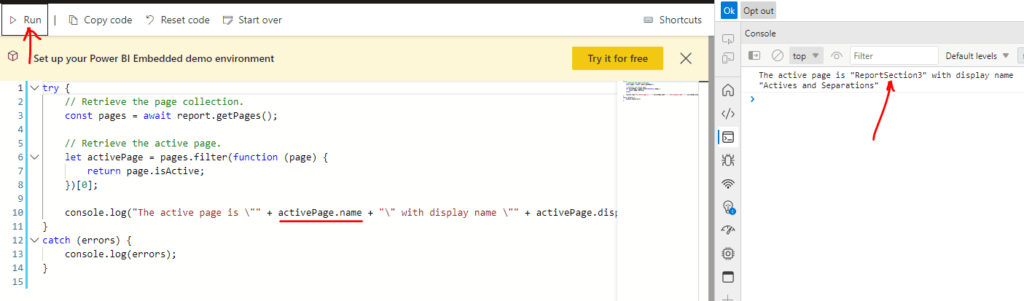
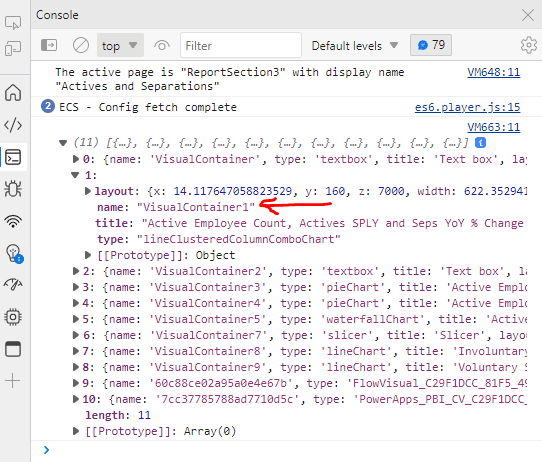
This will return and connect to the active page of the report that you are viewing. If you have multiple pages, make a selection on screen and then run this code. It will output the active page name in the console window - in my case ReportSection3. Once connected to this page, you can select and run get visuals.
3.2. Get visuals
This will return an array of all of the visuals for the specific page you have selected above. You can expand each object / visual to see the type and title which should help identify the name of the visual you are looking to export. Note that for my example the name is VIsualContainer1. I can supply this value directly to my Power Automate Action.
3.3. Get pages
Hopefully this needs no explanation, if you are really struggling to identify page names, run this and check the output on the console window.
Action Output
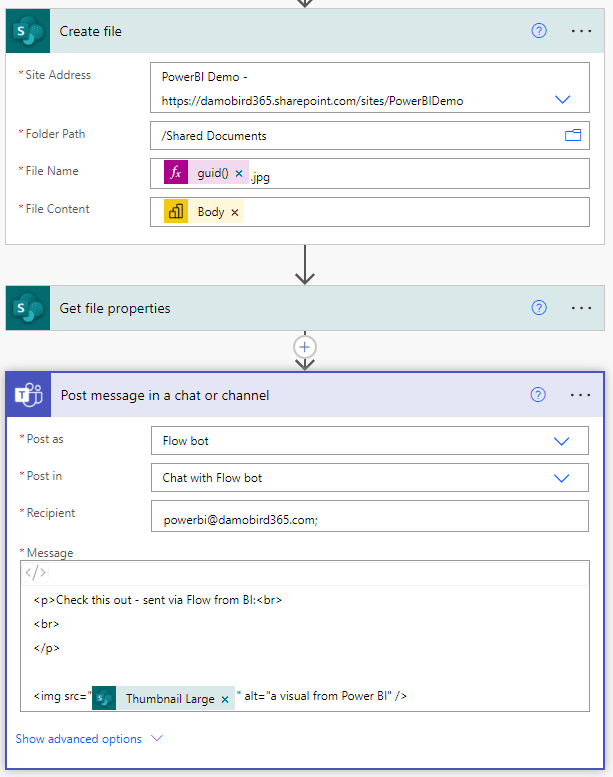
The easiest way to use the output is to save it to SharePoint or OneDrive. The filecontent dynamic value from the Power BI action is a base64 encoded image (unless of course you have specified multiple pages/visuals in which case it would be a zip file).
By saving the image to SharePoint you can embed the image using the thumbnail links available from the get file properties action. If you combine this with the img src html tags, you can display the image in a teams message. I did attempt to send the image as a base64 image for teams but at this point in time there is a 28KB image limit and so using the thumbnail link seemed like the next best option. You could of course directly embed the image into an email using base64 as demonstrated by w3docs. Note you will need to construct an expression to get the base64 encoding from the $content key.
outputs('Export_To_File_for_Power_BI_Reports')?['body']?['$content']
What’s next?
If your organisation already has the embedded workspace, I would love to hear if you have managed to implement the above automation. Have you sent images via Teams, Email or maybe even embedded them into Word templates? Did you use a Power App to implement a filter? Let me know in the comments below or drop me a message via my contact form.