Want to generate charts from Excel data and automatically send them to Teams, email, or embed them in Word and PDF documents? In this post, I’ll show you how to use Office Scripts with Power Automate to create dynamic charts as images and distribute them however you need. These charts can be created and returned as images to Power Automate and then used in any document of your choice. Send the chart via Teams. Send the chart(s) to external users via email. Embed the charts into Word, HTML, or permanent PDF files using Premium or regular actions.
The Office Script
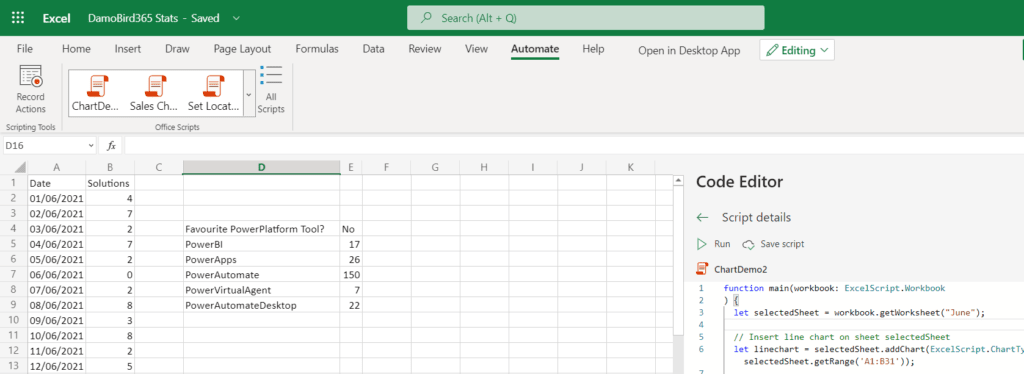
I have a couple of videos (at the bottom of the page) demonstrating the creation of Charts from Excel using Office Scripts. The script below assumes that data is already in the sheet and the range is fixed BUT you can dynamically identify the column & row range in use for the creation of Charts. Equally, you can apply a filter on the data and run the addchart() function on the filtered data. Below, we assume that our worksheet is called June. We then create both a line chart and a pie chart on two different data sets. Note these data sets do not have to be defined as tables. Using the getImage() function we can create a base64 representation of the Chart. You’ll note that both images are returned to the Flow as an array.
function main(workbook: ExcelScript.Workbook
) {
  let selectedSheet = workbook.getWorksheet("June");

  // Insert line chart on sheet selectedSheet
  let linechart = selectedSheet.addChart(ExcelScript.ChartType.line, selectedSheet.getRange('A1:B31'));

  // Insert pie chart on sheet selectedSheet
  let piechart = selectedSheet.addChart(ExcelScript.ChartType.pieExploded, selectedSheet.getRange('D4:E9'));

  piechart.getTitle().setText('Favourite PowerPlatform Tool');
  linechart.getTitle().setText('Total Solutions in June 2021');

  // set image variables
  let linechartimage = linechart.getImage();
  let piechartimage = piechart.getImage();

  //Delete charts from sheet
  linechart.delete();
  piechart.delete();

  // return linechart and piechart images
  return [linechartimage, piechartimage]

}
Whilst the script can be tested and called from within Excel Online, it can be triggered from a Flow. The automate tab of Excel is only available Online, don’t go looking for it on the Desktop client. Here you can record a script or start from scratch if you are confident with TypeScript. I often start by recording the steps I am looking to automate and then repurpose the code to suit my exact requirements.
The Excel Worksheet with two data sets
The Flow
Calling the Excel Office Script from Power Automate is done from the “Run Script” action. Here you must select the excel file you wish to run the script on and the script you wish to run. If you have defined parameters as part of your Office Script, the action will dynamically display them. In my example, I do not have any parameters only response, in the form of a results array.
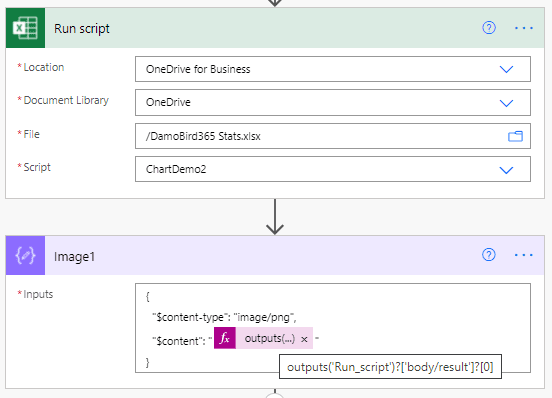
You will see above that I have used a compose action to create an image object. The expression includes the first result from the array. I also have an Image2 compose action, not shown above. The expression used here for the second image is outputs(‘Run_script’)?[‘body/result’]?[1]. This object is required by the Populate Word Template action but for HTML, Teams, and Email methods, you will use an expression for the first or second result. Your HTML will need to look something like the following:
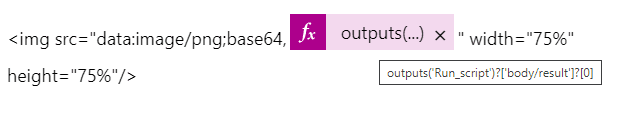
Note that you must include img src=“data:image/png;base64 when displaying the image as the office script will return it as a base64 string.
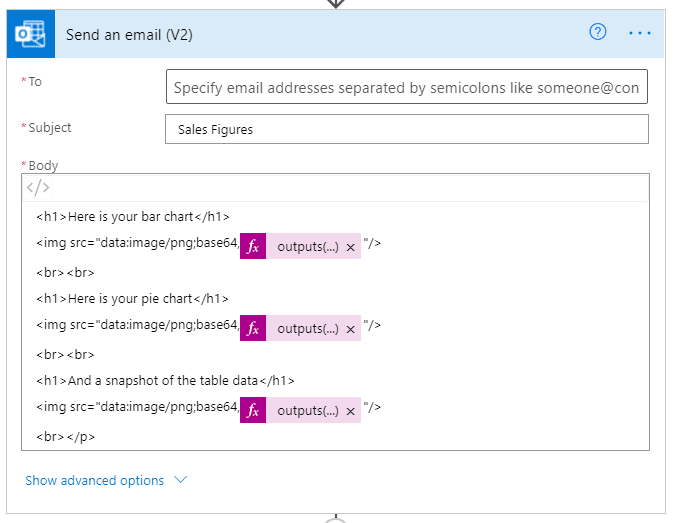
Charts Via Email
Using the “send an email” action, ensure the body is in the HTML editor and simply use the img src HTML per above. Depending on the number of charts that you have created, your body should look something like the following:
Email Action
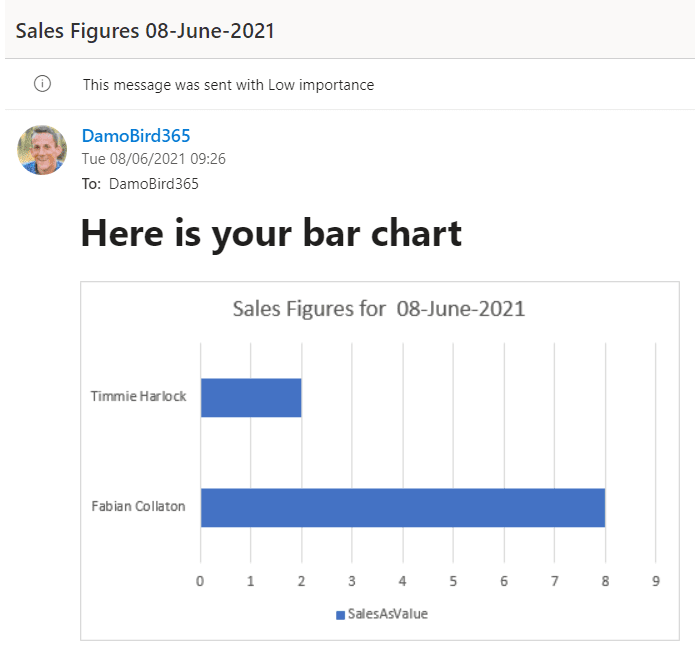
Sample Email with Chart
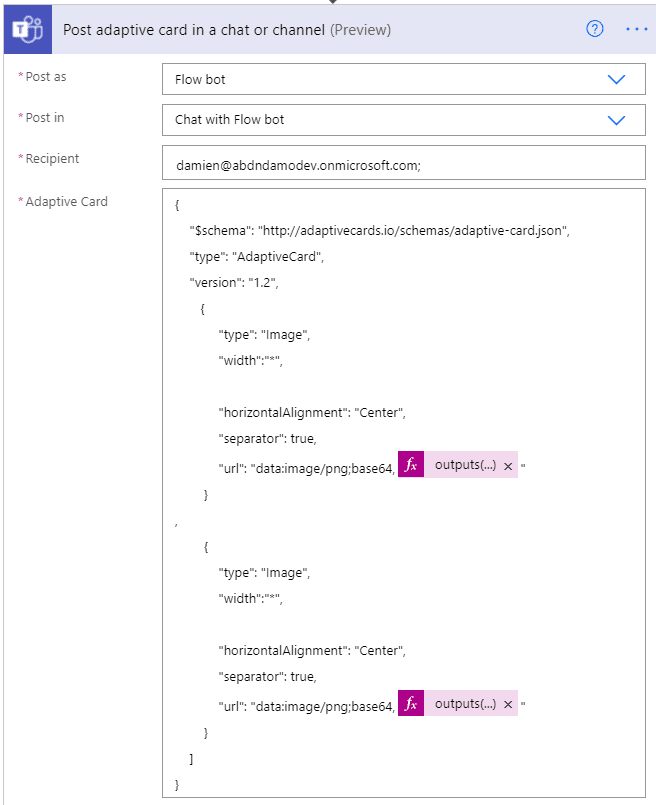
Charts via Teams
Very much like sending an email, you use the same expression as before. I’ve used the flow bot and an adaptive card. You can build your own adaptive card here.
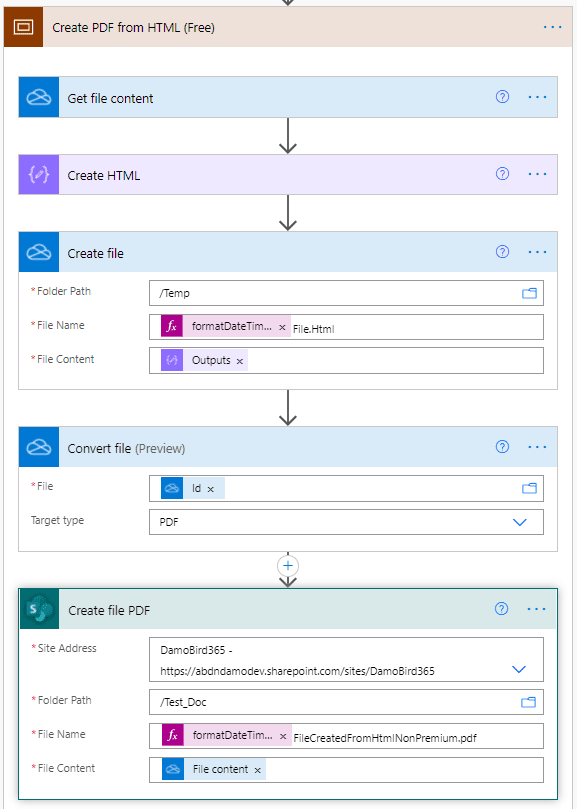
Charts in HTML and converted to PDF
This is the non-premium method for creating a read-only document in Power Automate. You can create an HTML file on OneDrive and then convert the file to PDF using the OneDrive convert file action. Getting the HTML file formatted is trial and error but it can be achieved using div to define page sizes and therefore page breaks. This also takes a lot of patience. Below I have included my sample HTML as used in my video.
<!DOCTYPE html>
<html>
<body style="background-color:white;">
<div style="background-color:white; width: 539px; height: 200px; text-align:center"><img src="data:image/png;base64, @{outputs('Get_file_content')?['body']?['$content']}" width="100%" height=100%"/></div>

<div style="background-color:white; width: 539px; height: 590px; text-align:center">
<h1>Welcome to your PDF DOC</h1>
<br>
<h1>Created by DamoBird365</h1>
<p style="color:red; font-size:50px;">Subscribe to my YouTube!</p>
<p style="color:red; font-size:50px;">YouTube.com/c/DamoBird365</p>
<p style="color:red; font-size:50px;">Comment with your ideas</p>

<br><br>
</div>
<div style="background-color:white; width: 539px; height: 790px; text-align:center">
<h1>Here is your line chart</h1>
<img src="data:image/png;base64,@{outputs('Run_script')?['body/result']?[0]}" width="75%" height="75%"/>
<br>
<h1>Here is your pie chart</h1>
<img src="data:image/png;base64,@{outputs('Run_script')?['body/result']?[1]}" width="75%" height="75%"/>
</div>
</body>
</html>
Below are the actions required to create these files. Note that OneDrive supports the file conversion, SharePoint does not. Therefore you convert the HTML file on OneDrive and then save the file contents to a file on SharePoint. Don’t forget to include your file extensions in the filename when creating files.
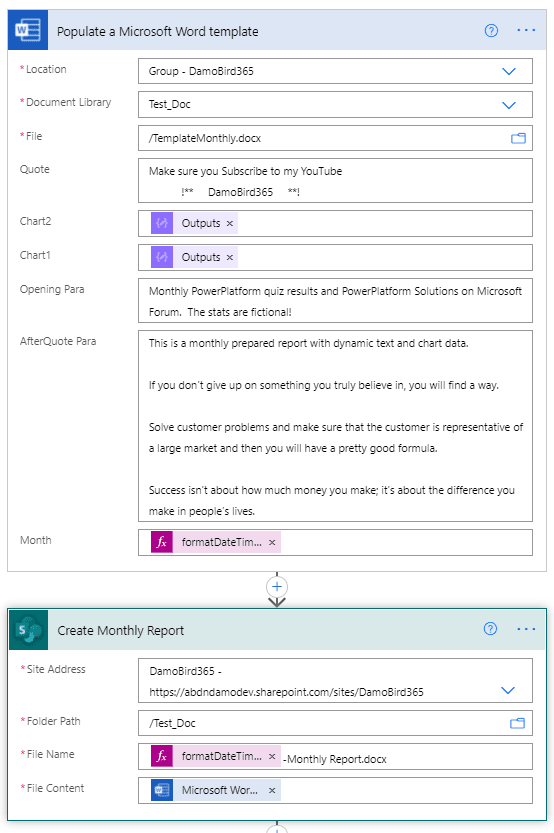
Charts in Word (Premium)
Using the “Word populate a Microsoft word template” action, you can insert the above images. Make sure you use the image object created in the earlier compose action. You must build the word template in Word Desktop, note that Word Online does not support editing of these features.
Using the developer tab (which you might need to add), you can insert various controls for dynamic content. I have inserted both text and image controls. You must specify a tag that will be used to identify the control from within the Word Action in your Flow. When you pass the image object to this control, the image is displayed dynamically.
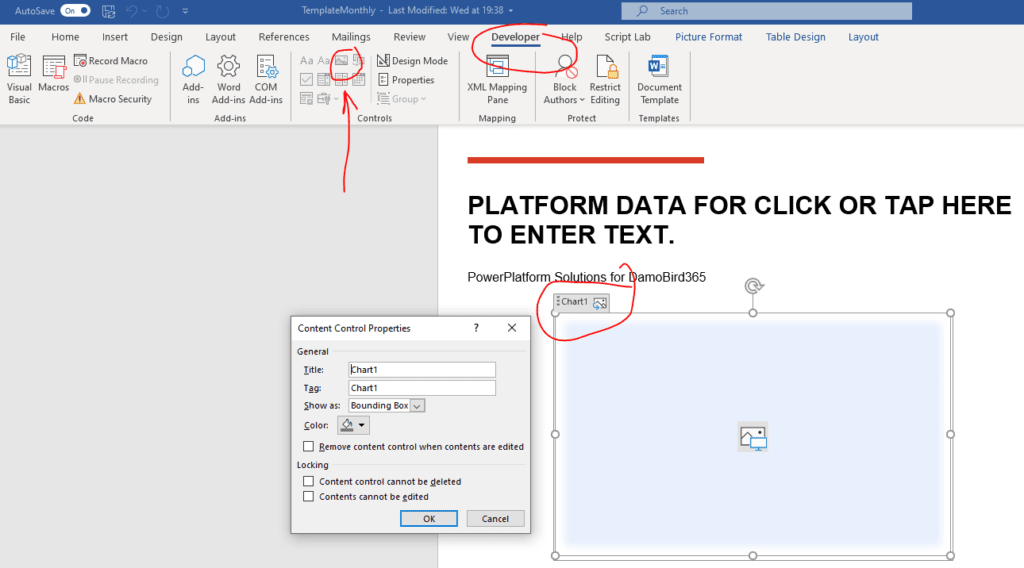
The word action requires that you specify the template file you are going to populate the data on. Note that this will not overwrite your template. You then need to ensure that the output from this action is saved to a file. Make sure you include that file extension.
The video demos
Want to see how to create charts using data collected from Microsoft Forms and then dynamically filtered, all from Power Automate and Office Scripts? In this video, I send the Charts to Teams and Email.
If you are looking to see static data (without tables) converted to charts and then saved to a file (Word, HTML, Or PDF) all from Power Automate, watch below. Remember your data can be collected from Power Automate and passed to Excel. I have examples of how to pass data to excel using Office Scripts.